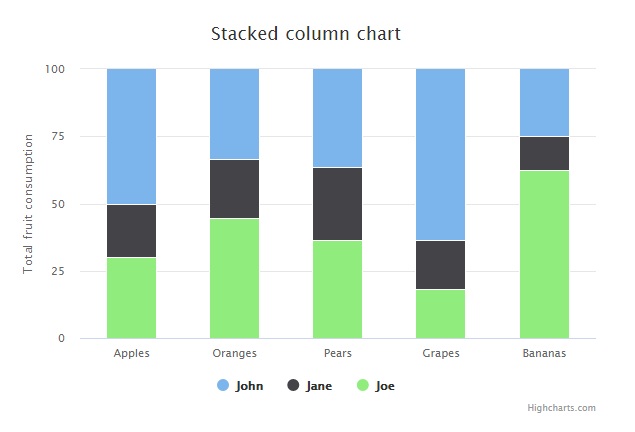
Template:
<template>
  <div >
    <div class="container">
        <div v-if="chartOptions.series[0].data.length">
        <highchart :options="chartOptions" />
        </div>
    </div>
</div>
</template>
TypeScript:
<script lang="ts">
import Vue from 'vue'

export default Vue.extend({

    data: function(){
        return {
            chartOptions: <any> {
                chart: {
                    type: 'column'
                },
                title: {
                    text: 'Stacked column chart'
                },
                xAxis: {
                    categories: ['Apples', 'Oranges', 'Pears', 'Grapes', 'Bananas']
                },
                yAxis: {
                    min: 0,
                    title: {
                        text: 'Total fruit consumption'
                    }
                },
                tooltip: {
                    pointFormat: '<span style="color:{series.color}">{series.name}</span>: <b>{point.y}</b> ({point.percentage:.0f}%)<br/>',
                    shared: true
                },
                plotOptions: {
                    column: {
                        stacking: 'percent'
                    }
                },
                series: [
                    {
                        data: []
                    }
                ]
            }
        }
    },

    async fetch() {
        var that = this

        //AJAX emulator
        setTimeout(function(){
            that.chartOptions.series =   [{
                    name: 'John',
                    data: [5, 3, 4, 7, 2]
                }, {
                    name: 'Jane',
                    data: [2, 2, 3, 2, 1]
                }, {
                    name: 'Joe',
                    data: [3, 4, 4, 2, 5]
                }]
        },2000)

    }
})
</script>


